

Supervisors will use the Analytics Workspace to view different statistics for the Call Center. Please see The Workspaces for details on how to access the Analytics Workspace.
For a Supervisor the default view shown when the Analytics Workspace opens should be the Interactions panel where all current and completed interactions can be seen. Views can be modified to add or remove information as necessary.
To add columns to a view select the + in the top right hand corner of the view. The Add/Remove Column panel will open. Use the search field to type in the name of the column to be added or removed if you know the name. The list is also broken down by Views that the columns would be used in. Scroll through the list to see all of the possible columns that can be added. To add the column, place a check in the box. To remove a column, remove the check. Once the columns have been added or remove, select the Save button at the bottom.
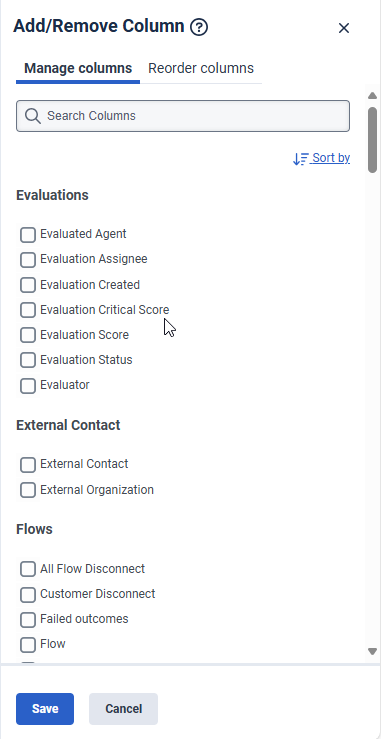
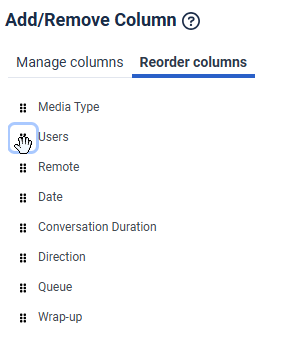
Columns can be reordered using the Reorder columns tab at the top of the Add/Remove Column panel. Use the Move
icon and select and drag the field up or down in the list.
Supervisor Views
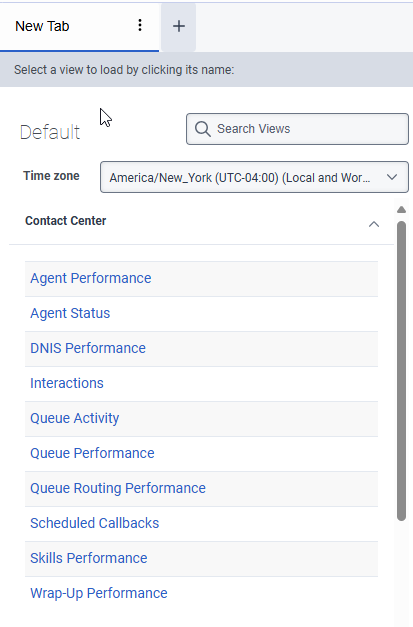
The views used most often by supervisors are in the category called Contact Center. Add a tab to the Analytics Workspace by clicking the + icon. The different available views will be displayed.
- Agent Performance
- Agent Status
- DNIS Performance
- Interactions
- Queue Activity
- Queue Performance
- Scheduled Callbacks
- Skills Performance
- Wrap-Up Performance
Last modified: Oct 8, 2025